 Habitveen
You earn a decent amount, you don’t feel wasteful — and yet the month ends with less than you expected. That gap almost always comes down to one thing: you can’t see your spending clearly. Here’s how to fix that.

1. Start with the trend, not the total
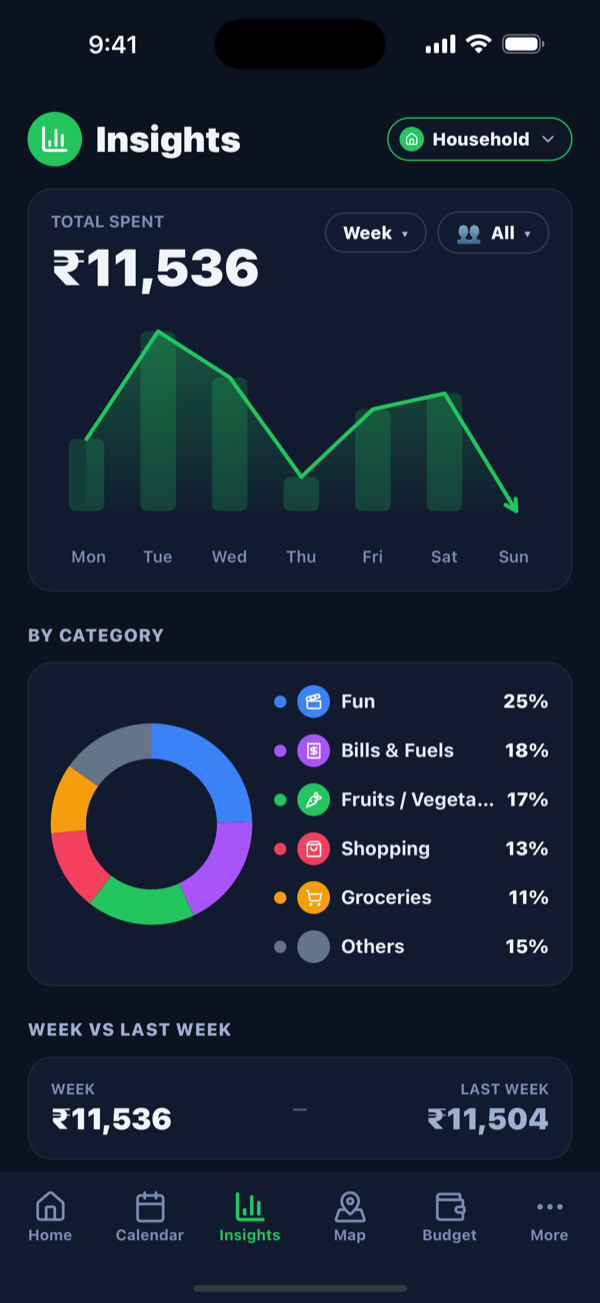
A single monthly total tells you almost nothing. What helps is the trend — how this month compares to the last, and which days you spend the most. In Habitveen, the Insights tab shows your month total, the change versus last month, and a spend-trend chart at a glance, so you spot a creeping increase before it becomes a habit.
2. Break it down by category
The real answer to “where did it go?” is a category breakdown. Once you see that, say, Food & Drinks and Investments are your two biggest buckets, you can make one deliberate decision instead of a hundred guilty ones. Habitveen shows a clean donut breakdown — Groceries, Bills, Investment, Home and more — so the picture is obvious in a second.
3. See where you spent — literally, on a map
Sometimes the pattern is a place, not a category: a particular market, a food street, a mall. If you tag an expense with its location (one optional tap), Habitveen plots every located spend on a Spend Map — with filters by month, family member and category, and a search across places and notes. It’s a genuinely different way to notice leaks.
4. Log fast, or you won’t log at all
None of this works if entering an expense is a chore. That’s why Habitveen leans on speed: type “milk 60” in plain words, or tap a category icon from Home. Two seconds, and it’s in — which is the only way the insights stay accurate.